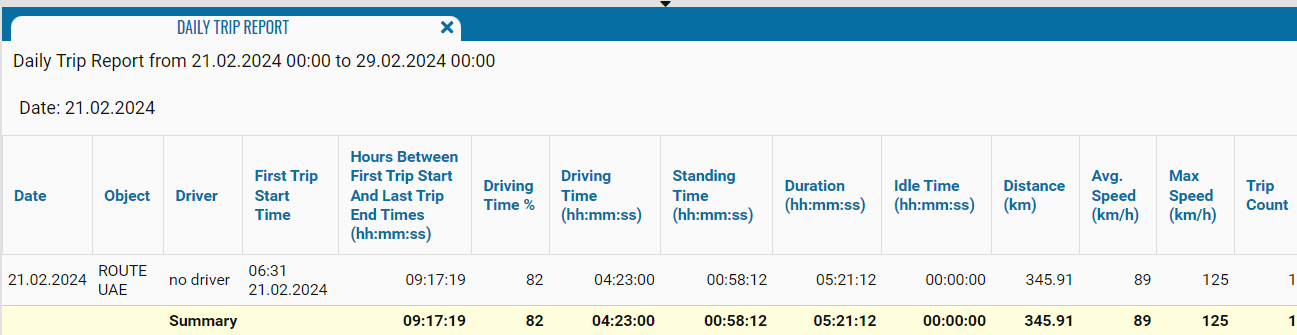
Daily trip report
This report shows how each vehicle and driver performed during the day.
It allows you to see:
— when the first trip started and the last trip ended
— how much time the vehicle spent driving, parked, and idle
— total mileage and speed for the day
— how many trips were completed
What the report shows
• Selected period — the date range for which the report is generated
• Specific date — the date currently displayed in the table

Report fields
The report is built by days: one table row = one working day of one vehicle
• Date — the date when the first trip of the day started
• Object — the vehicle
• Driver — the driver assigned to the vehicle on that day (if no driver is assigned, no driver is shown)
• First trip start time — date and time when the vehicle first started moving during the day
• Time between first start and last end (hh:mm:ss) — total “working time” of the vehicle for the day, from the first trip to the last one, including driving and stops
• Driving time % — percentage of working time spent driving
• Driving time (hh:mm:ss) — total time in motion during the day
• Standing time (hh:mm:ss) — total time of stops and parking between trips
• Duration (hh:mm:ss) — total vehicle activity time for the day (driving + parking)
• Idle time (hh:mm:ss) — time when the vehicle was powered on but not performing work (for example, engine idling)
• Distance (km) — total distance traveled during the day
• Average speed (km/h) — average speed for the day (distance divided by driving time)
• Max speed (km/h) — maximum recorded speed for the day
• Trip count — number of individual trips completed during the day
At the bottom of the table, the Total row automatically calculates:
— total working time
— total distance
— average values across all rows for the selected date