Report PetroApp Monthly
The main task of the report is to calculate the differences in fuel consumption compared to factory indicators.
PetroApp Monthly - the report is built only by months.
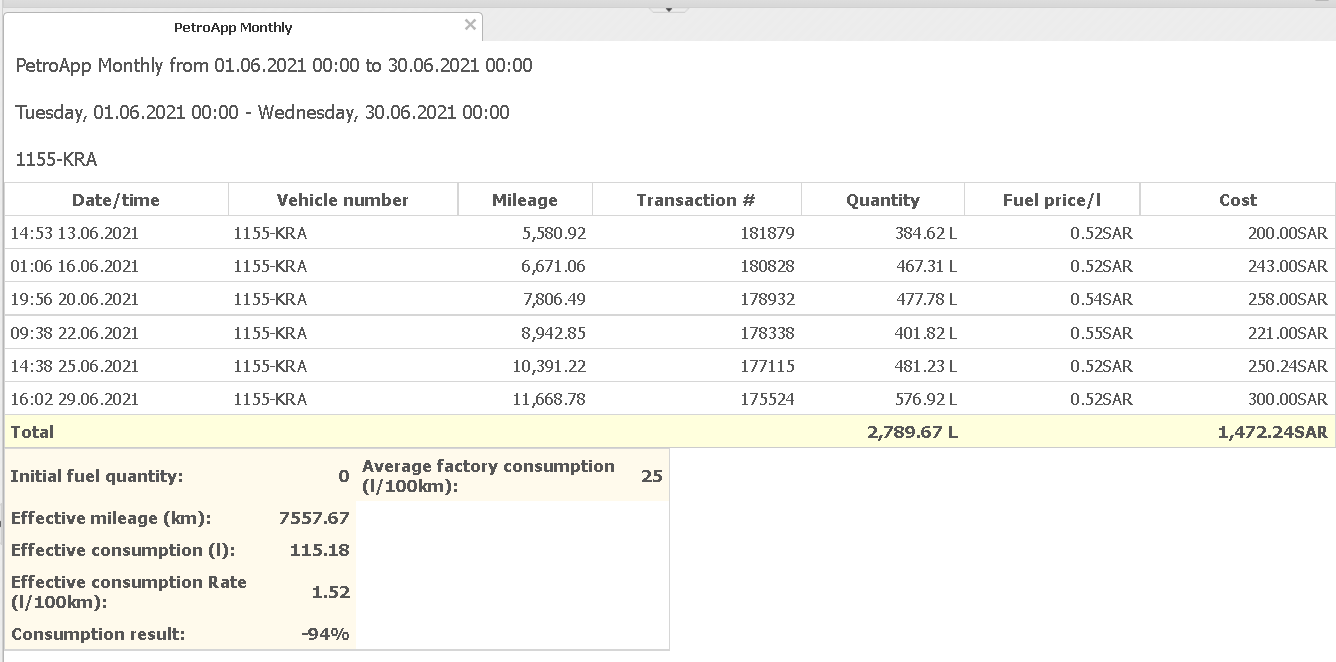
• Mileage is the mileage at the time of the transaction.
• Transaction is the ID of the transaction.
• Fuel price - cost.
• Quantity is the volume in liters.
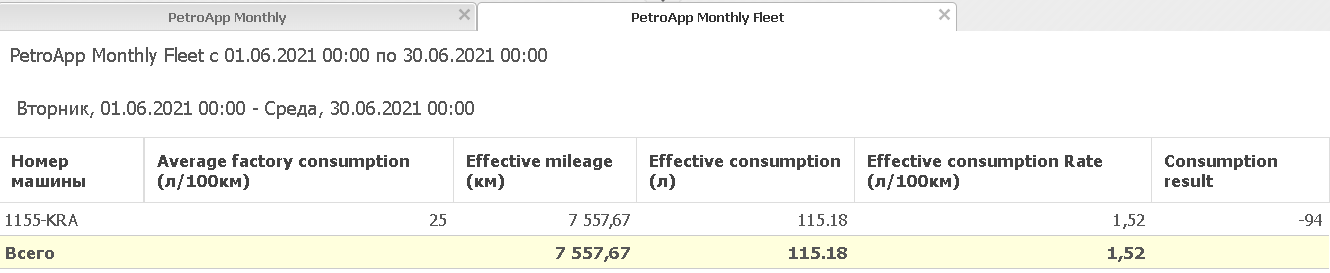
• Effective mileage (KM) is the total mileage for the period calculated by the formula "Last transaction mileage" minus "First transaction mileage".
• Effective consumption (Liters) - the sum of all liters from transactions.
The report includes only those transactions followed by other transactions.
For example transactions:
1. 03/07/2021 - 20 liters
2. 03/08/2021 - 30 liters
3. 03/09/2021 - 25 liters
4. 03/10/2021 - 40 liters
Only 1,2,3 are included in the report.
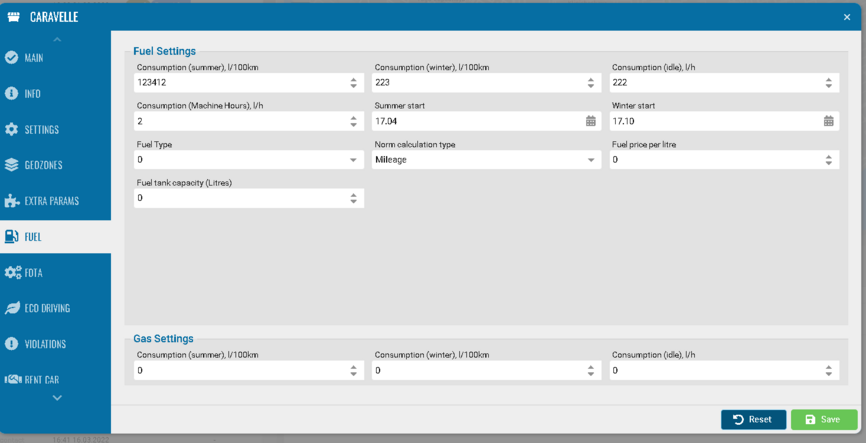
• Average factory consumption (L/100KM) - factory indicator. Taken from the object settings.
• Consumption result - percentage difference.
• Effective consumption Rate (L/100KM) - calculation of consumption per 100 km.
An abbreviated PetroApp Monthly report with summary data.
To work proper, need to make sure tank size is set for the vehicle and fuel consumption.