Connecting BI Analytics in Power BI
This article demonstrates how to connect BI Analytics to Microsoft Power BI. The same approach can be used with any BI platform that supports REST APIs.
How to add a query in Power BI
1. Open Power BI Desktop
Launch Power BI Desktop on your computer. If it is not installed, download it for free from the official Microsoft website.

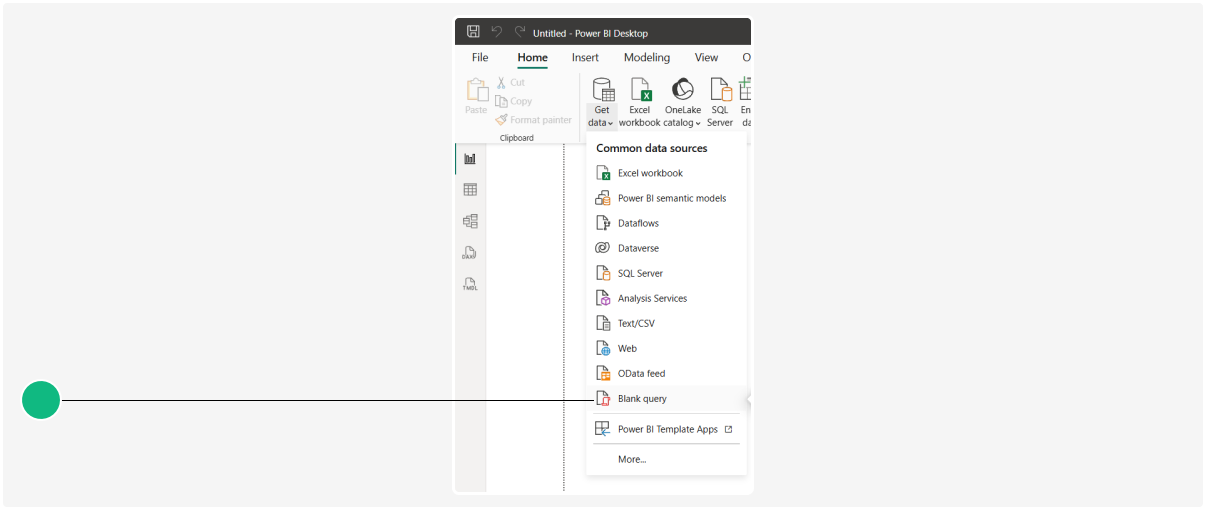
2. On the main toolbar at the top, click the Get Data button. A list of available data sources will appear

3. From the list of data sources, select Blank query
4. The Power query editor will open. This is the window where queries are created and configured.
In this window, find the Advanced editor button on the top toolbar and click it.

5. The Advanced editor window will open with an empty query template.
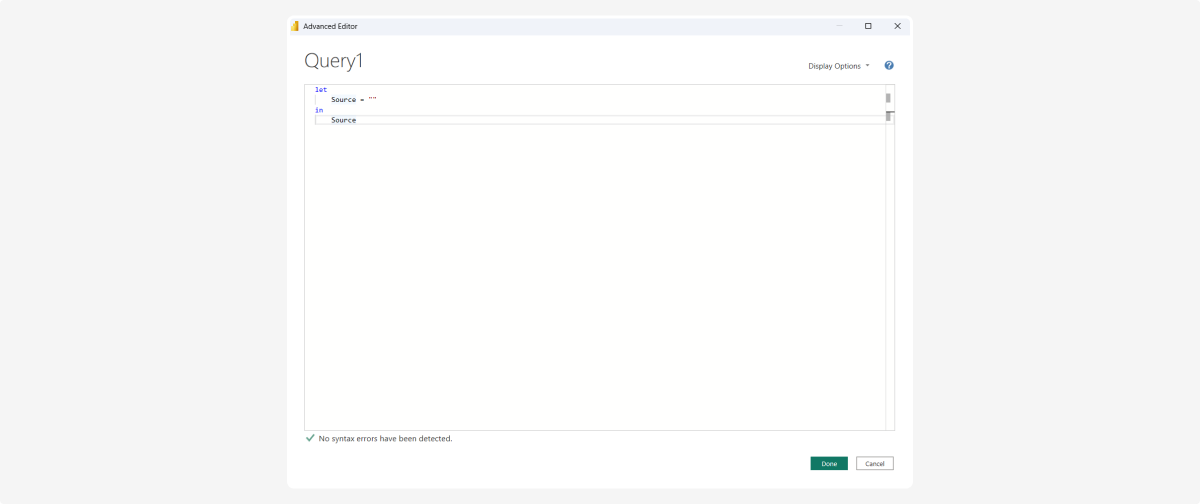
6. Paste the query code into the editor. See the example query below
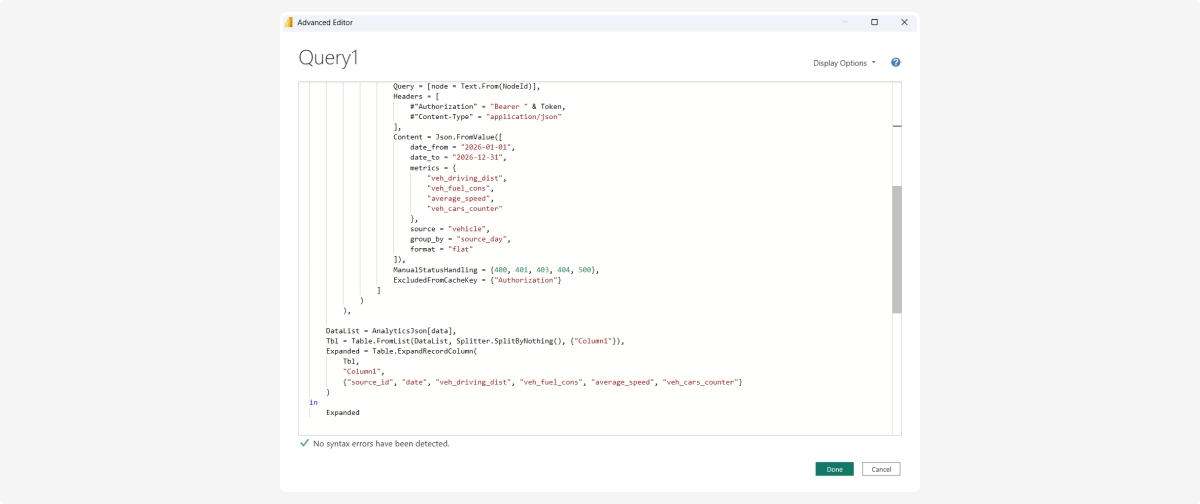
In the query, you need to specify:
-
Server address — the URL of your server
-
Login — your login from the partner account
-
Password — your password from the partner account
-
Dates — the start and end dates of the period
-
List of metrics — which data you want to retrieve (see the full list of metrics below)7. After pasting the code, click DonePower BI will start connecting to the server and loading data.8. After that, Power BI may display the warning “Information is required about data privacy”. Click Continue.
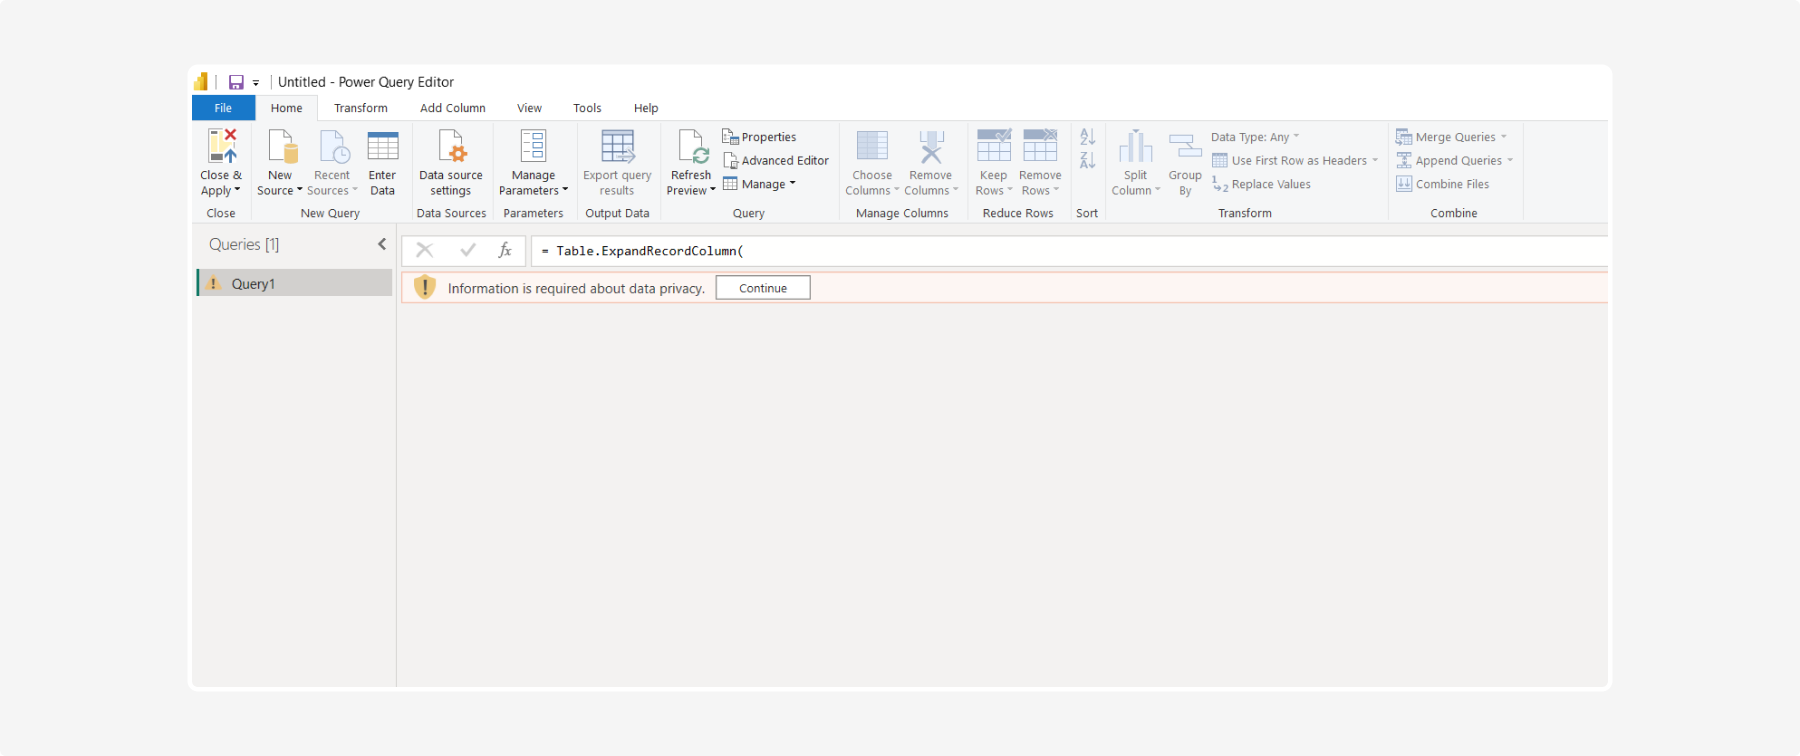
9. The Privacy levels window will open.
In this window, Power BI checks whether it can safely combine and process data from the sources used in the query. In our case, the query uses one trusted data source, and authorization is already handled inside the query itself. To prevent Power BI from blocking the load or interfering with query execution, check: Ignore privacy levels checks for this file.
Then click Save.
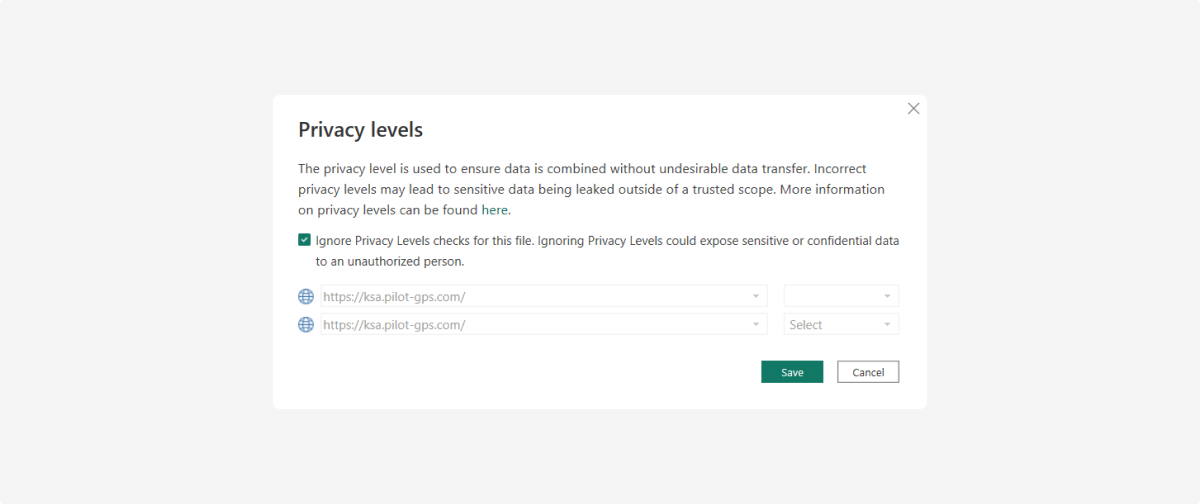
10. After saving, Power BI will execute the query and open a data preview in Power query editor.
You will see a table with rows and columns — this is the data returned by your query.
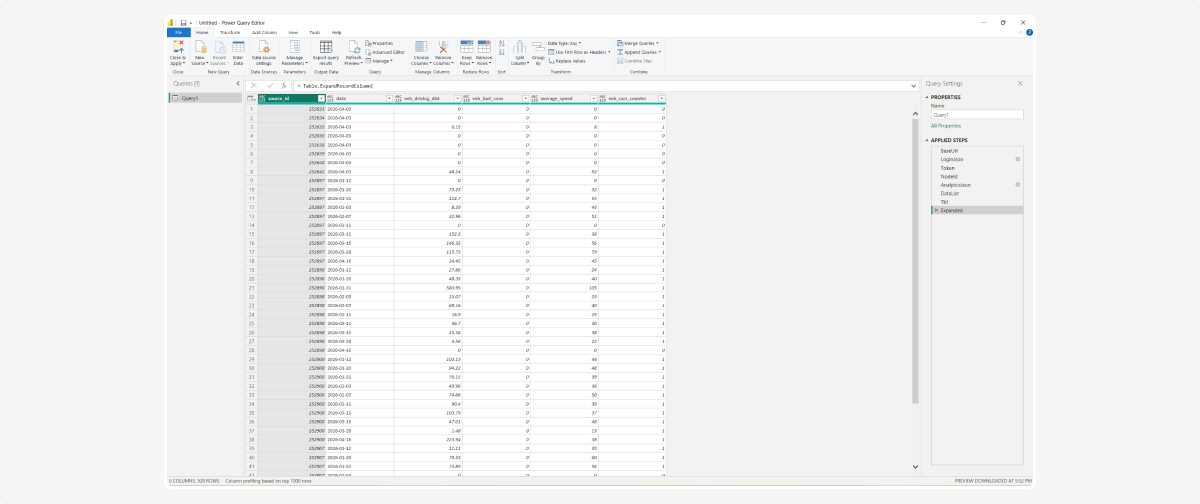
11. Click Close & Apply. After that, the data will be loaded into Power BI, and you can start working with it.

Now you can use the loaded data to create charts, tables, and other visual elements.
In the main Power BI Desktop window, the following panels are usually displayed on the right:
-
Visualizations — contains chart types, diagrams, cards, tables, and other visual elements. Choose the type you need, then fill it with your fields
-
Data — shows the list of tables and fields loaded from your query, such as date, object ID, mileage, fuel consumption, and average speed. You can use these fields in visualizations by selecting them with checkboxes, dragging them with the mouse, or rearranging them
-
Filters — lets you limit data using the conditions you need

How to build a chart
1. In the Visualizations panel, click the chart type you need. A blank chart template will appear on the report canvas
2. In the Data panel, select the fields you want to display

3. Power BI will automatically place the selected fields into the chart.
In Power BI, you can combine data in different ways:
-
add the same field to multiple charts
-
compare several indicators
-
build multiple visualizations on one page
-
replace fields without recreating the report from scratch

If the query doesn't update or you get login errors
Sometimes Power BI saves the previous connection settings for a data source. Even if you change the login, password, or server address, the query may keep returning an authorization error because Power BI is still using the old credentials. In this case, you need to clear the saved permissions so that Power BI asks for the credentials again.
How to clear permissions
1. In the Power Query Editor, click Data source settings on the toolbar
2. In the window that opens, select the data source you need — for example, your server address
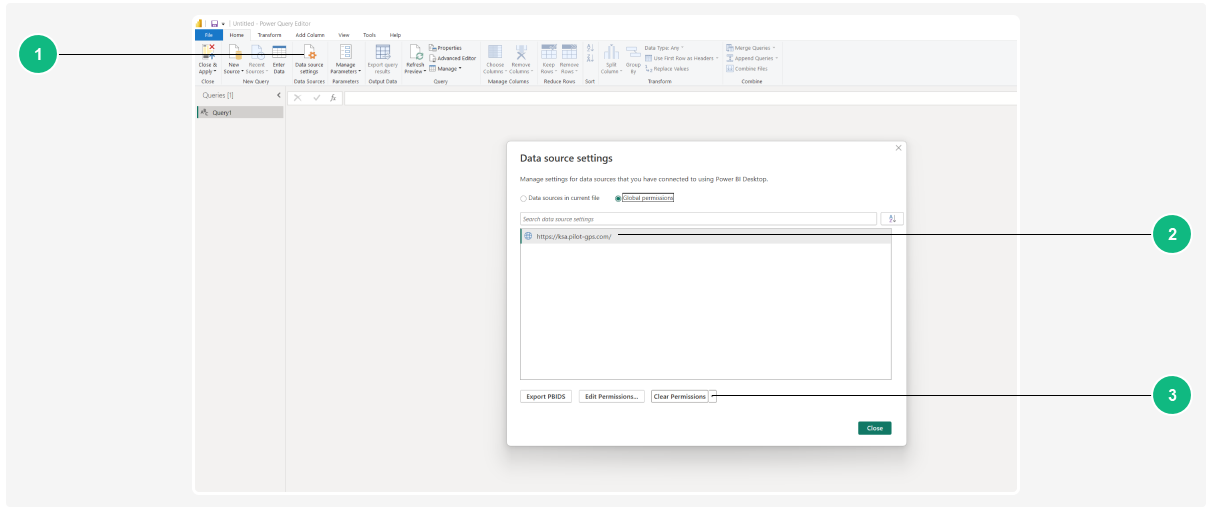
1 — Button Data source settings
2 — Select your data source
3 — Button Clear Permissions
3. Click Clear Permissions
4. In the confirmation window, click Delete

5. Run the query again. Power BI will reapply the connection settings with the new credentials.