How to set up the calibration table of the sensor
1. Graph calibration table — converts raw values to real ones using a graph. Commonly used for fuel level, weight, temperature, humidity sensors.
2. Text states calibration table — converts raw values into predefined statuses (e.g., “No Signal,” “Weak,” “Good”).
Example: Fuel tank calibration
Suppose the tank has an irregular shape, so volume is not directly proportional to fuel level. The sensor measures resistance (Ohm) instead of liters.
You must perform calibration by emptying and filling the tank step by step, recording resistance at each fuel level.
Example calibration table for a 100-liter tank:
|
Fuel level (L)
|
Resistance (Ohm)
|
|
0
|
180
|
|
10
|
160
|
|
20
|
140
|
|
30
|
120
|
|
40
|
100
|
|
50
|
80
|
|
60
|
60
|
|
70
|
50
|
|
80
|
40
|
|
90
|
20
|
|
100
|
10
|
When the sensor sends 100 Ohm, the system knows there are ~40 liters in the tank.
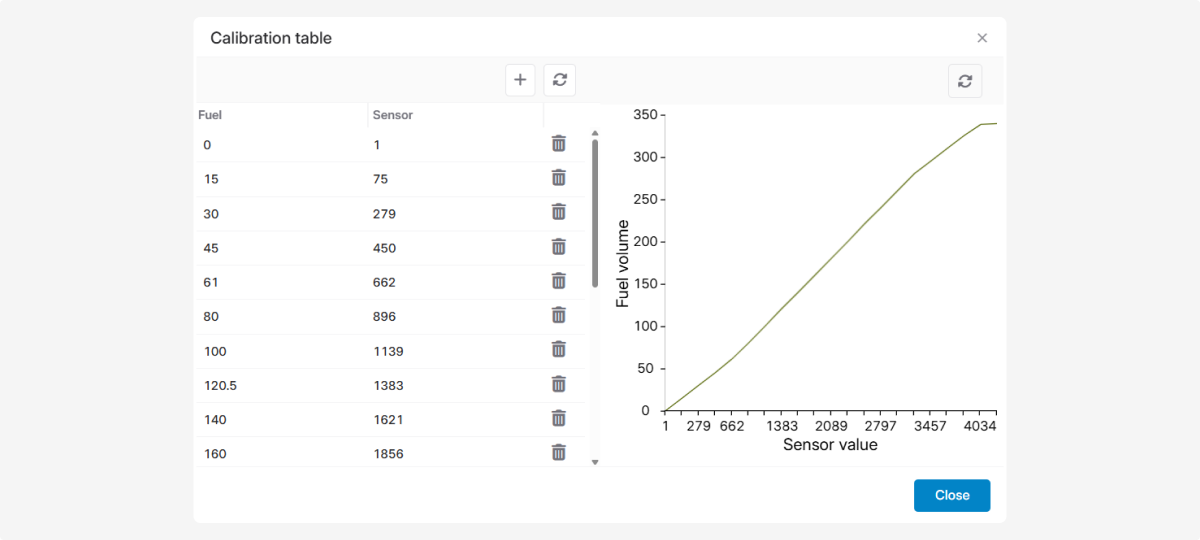
Graph calibration table
This type of calibration table converts sensor readings into real values using a dependency graph. On the X-axis, you see the sensor readings, and on the Y-axis, the actual measured values. A graph is built between the recorded points, which determines the real value for each sensor reading.
This type of calibration table is often used for fuel level sensors, weight, temperature, and humidity sensors.
How to create a table
You can configure the table in the sensor parameters window or upload a ready-made table from a file.
The configured table can be saved to a file and reused for other similar sensors.
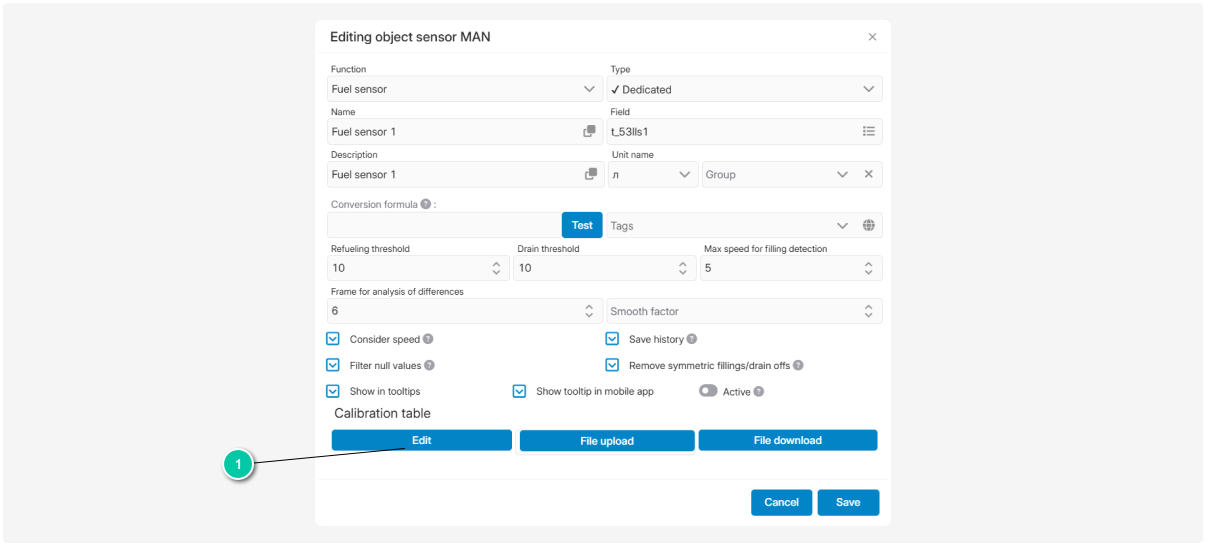
To open the calibration table, click Edit.
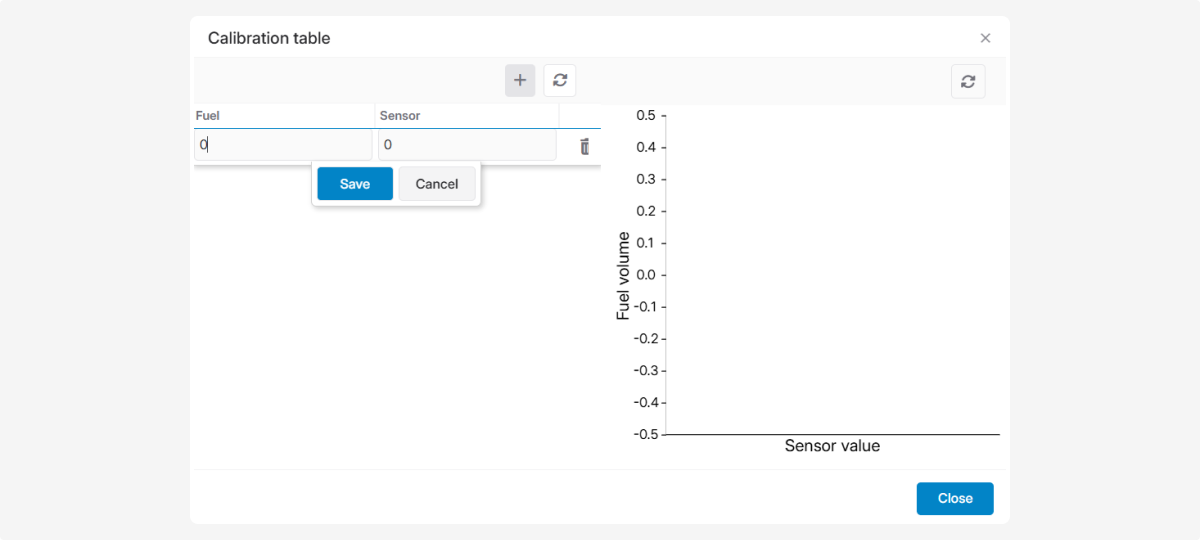
How to add values to the table:
-
Click Add

2. Enter the actual amount of fuel and the value displayed by the sensor
3. Click Save
4. Repeat these steps for all required reading
Text states calibration table
This type of calibration table is used for multi-position sensors and converts sensor readings into predefined statuses.

Example of using this type of table
Suppose you have a multi-position GPS antenna sensor that shows signal strength. The GPS receiver measures signal power in dBm, usually ranging from -160 dBm to -120 dBm.
In the table, you translate the technical values from the sensor into understandable statuses:
-
No signal
-
Weak signal
-
Medium signal
-
Strong signalFor example, when the sensor sends a value of -135 dBm, the system finds the corresponding value in the table and translates it into a text status — Weak signal.The text status will appear in the object tooltip and in reports.This type of calibration table can be used for various parameters.For example:Set value ranges for temperature: Cold — 0–10°C, Warm — 10–25°C, Hot — 25°C and aboveShow battery charge not in percentages but in statuses like Low, Medium, Full.How to add a calibration table for multi-position sensors:
-
Open the sensor parameters window2. In the Calibration table section, click Edit3. In the calibration table window, click Add4. Fill in the columns with the sensor’s minimum and maximum values5. Set text statuses in the Semantics column6. Select an icon and a background color for the status. The status color is used in charts and in the track history when displaying routes7. Click Save