Map
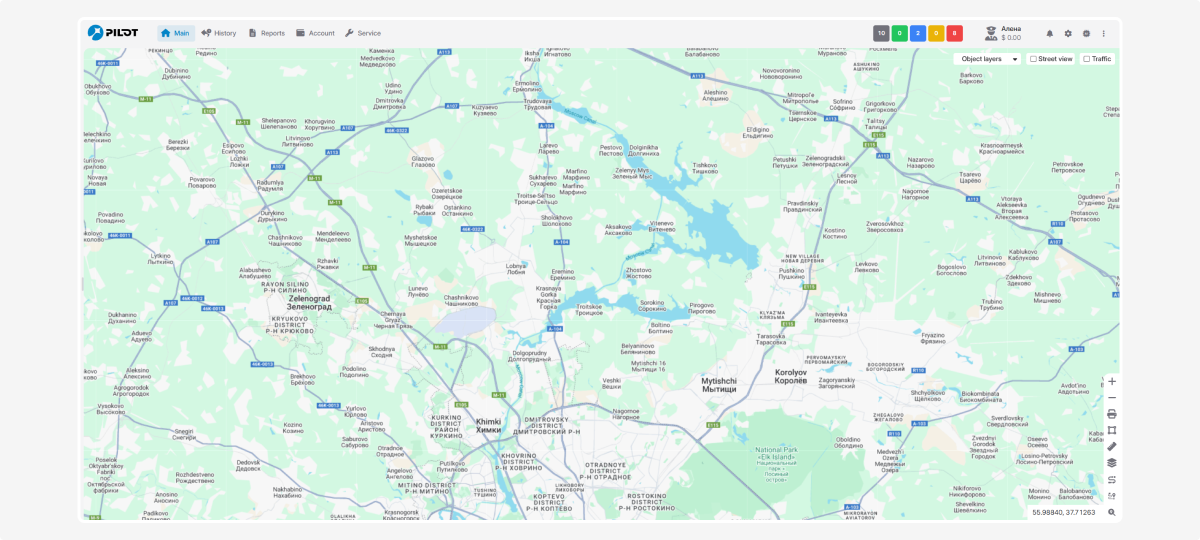
The map is a tool that visually shows what’s happening with your objects.
The map displays:
-
Monitoring objects
-
Their current location
-
Movement routes
-
Key geographic points and places
-
Geofences
-
Additional object details, such as status, speed, and direction
The map is available across tabs and sections and usually takes up most of the screen.
To get the widest map view, you can hide the workspace. Click the divider to collapse it.
If you want to see only the map and hide all panels, headers, and browser controls, press F11 to enter full-screen mode.
Searching for objects on the map
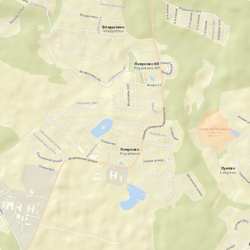
When you select objects in the list, they automatically appear on the map.
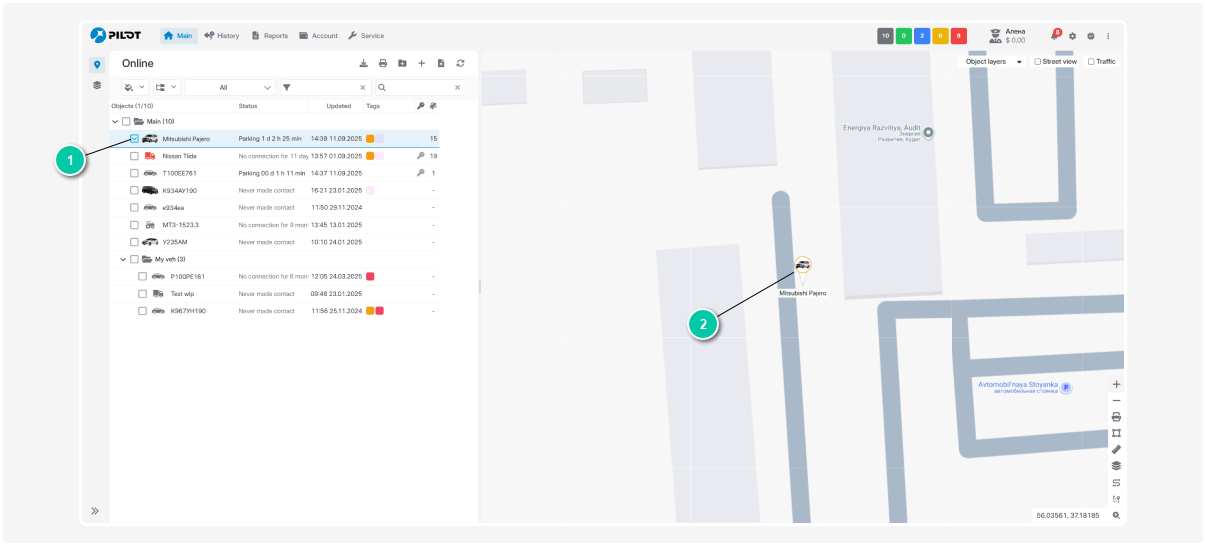
1 — Selecting an object in the list. To select an object, check the box next to it
2 — Object on the map
Moving around the map
To move around the map, press and hold the left mouse button and drag in the desired direction. The map will move with the cursor. To view another area, just drag the map.
All tools for working with the map are grouped in one place — a dedicated panel in the bottom-right corner of the screen.
Zoom
You can change the map scale in several ways:
1. Zoom buttons  и
и 
In the top-left corner of the map, use the quick zoom in and out buttons. When you click them, the map zooms while keeping the center point in place.
2. Mouse scroll wheel
Scroll forward to zoom in and backward to zoom out. The cursor indicates which area you want to examine in detail.
3. Double-click
Double-click the left mouse button anywhere on the map to zoom in.
The current coordinates are always visible in the bottom-right corner and update as you move the cursor over the map.
Print map
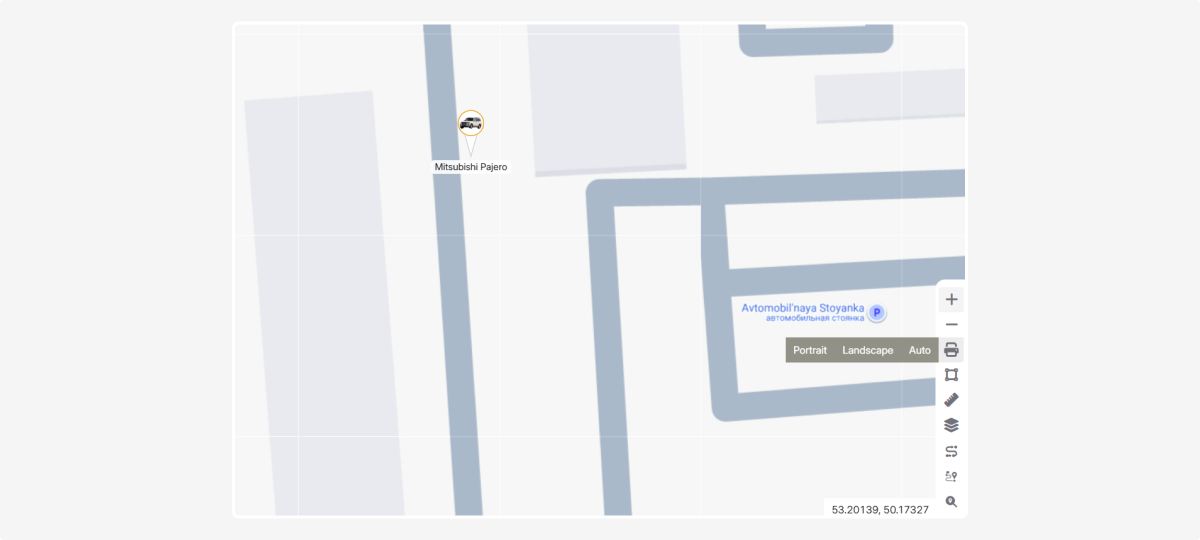
This feature prints the current map view. When you click the Print button, you can choose one of three orientations:
1. Portrait — vertical orientation. Good for areas that are tall/narrow
2. Landscape — horizontal orientation. Useful for wide areas or horizontally arranged objects
3. Auto — the system automatically selects the best orientation based on the current map view and its proportions
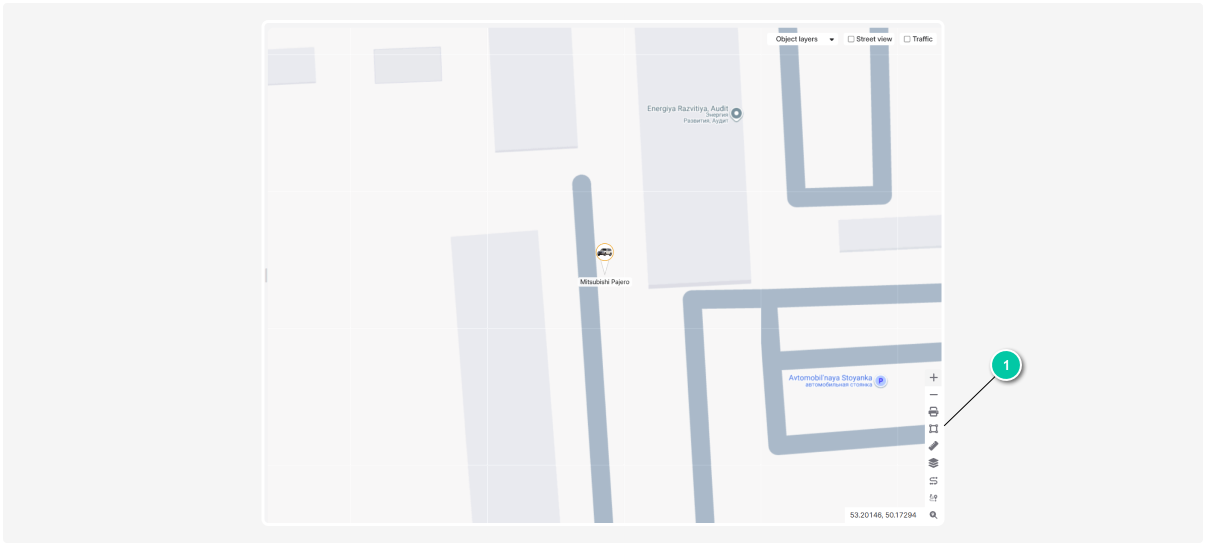
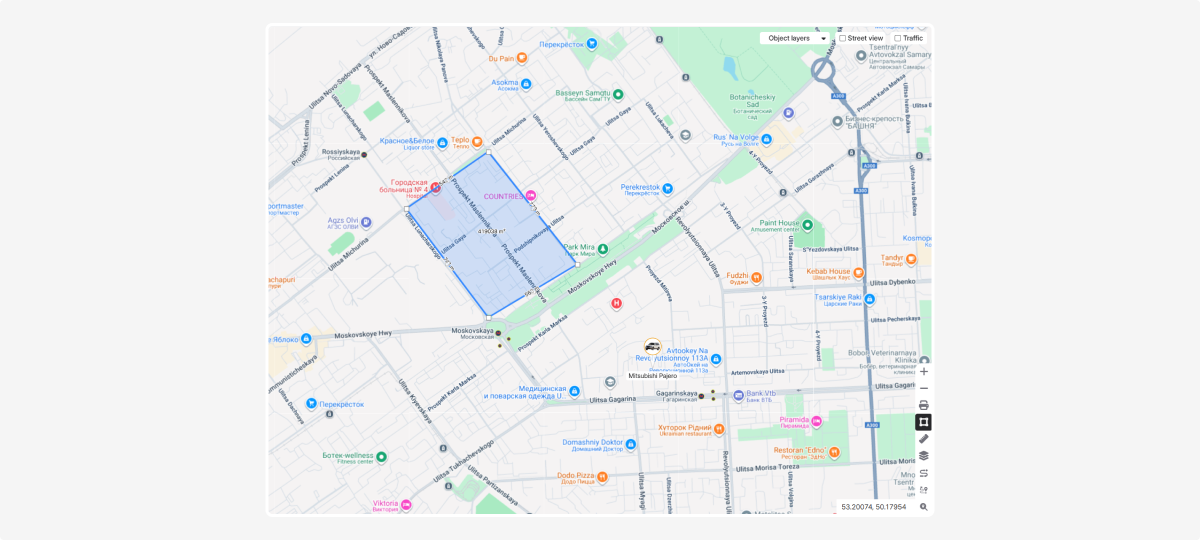
Measure area
This tool helps you calculate the area of a selected region on the map.
How to use:
-
Click on the map to mark the vertices of the shape you want to measure
2. When you finish drawing the shape, the system will automatically calculate and display its area
Measure distance between points
This tool helps you calculate distances between any points on the map.
How to use:
-
Click on the map to set the first point
2. Click again to set the second point
3. A line will appear between the points showing the distance
To measure multiple segments, keep clicking to add points. The length of each segment will be shown next to it.
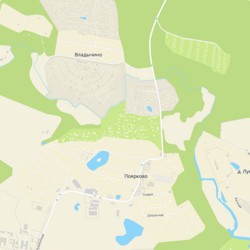
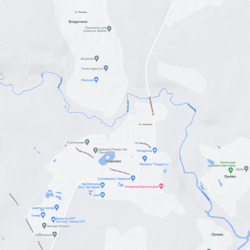
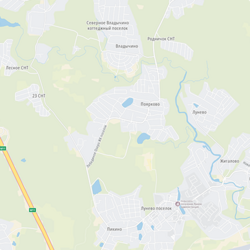
Choose map type
In professional cartography this is called a basemap. For simplicity, we’ll use the term map type, which refers to the base layer used to display spatial data in the monitoring system.
PILOT offers several map types for the user interface. Choose the one that best fits your needs—some are better for navigation, others for exploring terrain or finding infrastructure.
To change the map, click the Map selector button  .
.
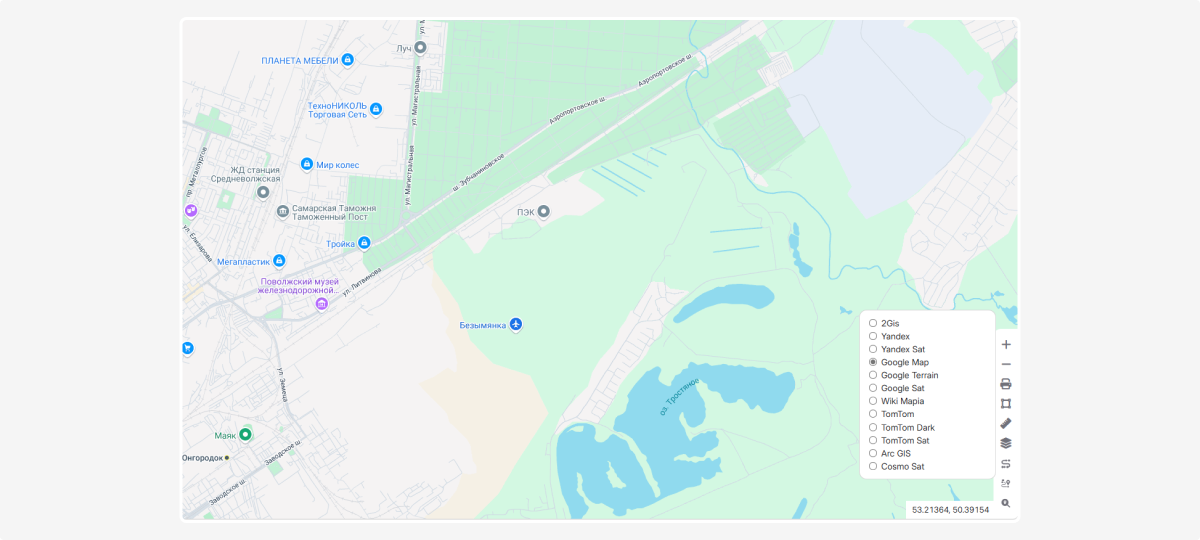
In the menu that opens, select the desired map type — it will become your default and load automatically when you open the system.
|
Map types
|
View
|
Description
|
|
OpenStreetMap (OSM)
|
 |
An open online map regularly updated by contributors from around the world
|
|
2GIS
|
 |
A detailed city map with street and building names; highly detailed and convenient for finding places
|
|
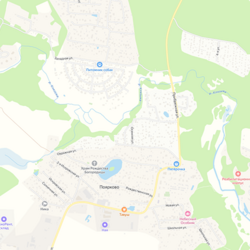
Yandex
|
 |
A map by the Russian company Yandex showing cities and regions with roads, places, transit schemes, and traffic
|
|
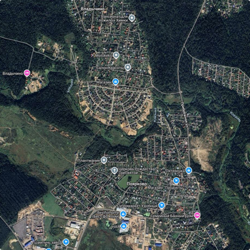
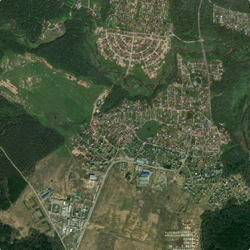
Yandex Satellite
|
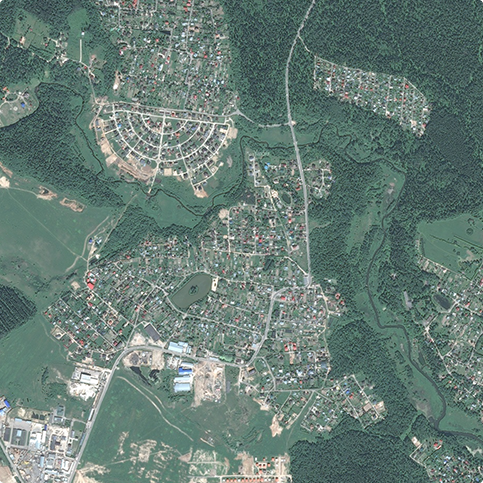 |
High‑resolution satellite imagery from Yandex with detailed terrain visualization
|
|
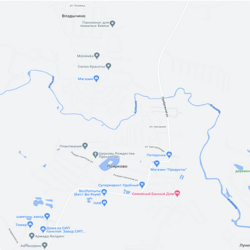
Google Map
|
 |
Google’s standard map with global coverage and regular updates
|
|
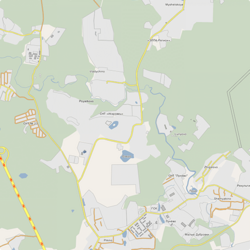
Google Terrain
|
 |
A Google map view emphasizing terrain and elevation
|
|
Google Satellite
|
 |
High‑resolution satellite imagery from Google with regular data updates
|
|
WikiMapia
|
 |
A detailed map with object descriptions, created using data from OpenStreetMap and Wikipedia
|
|
TomTom
|
 |
A navigation map from TomTom showing detailed road routes; widely used for in‑car navigation
|
|
TomTom Dark
|
 |
A dark version of the TomTom navigation map
|
|
TomTom Satellite
|
 |
High‑resolution satellite imagery from TomTom
|
|
ArcGIS
|
 |
A professional geographic information system with multiple data layers
|
|
Cosmo Sat
|
 |
High‑quality satellite imagery covering the entire Earth
|
|
Dark
|
 |
A dark map style, convenient for evening or nighttime use; reduces eye strain
|
|
Gray
|
 |
A gray‑scale map with a neutral design and improved readability
|
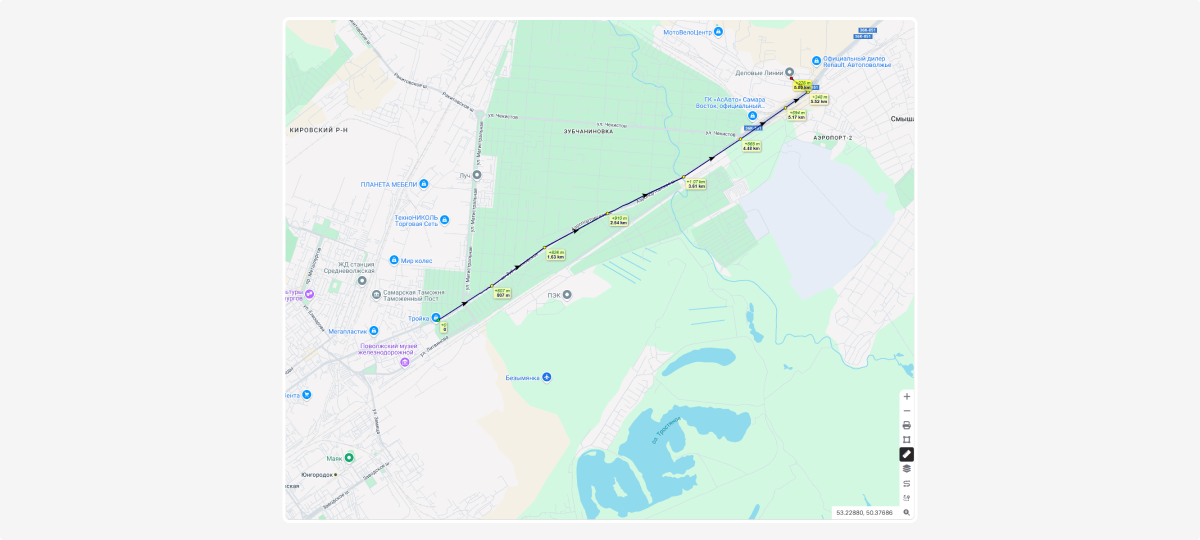
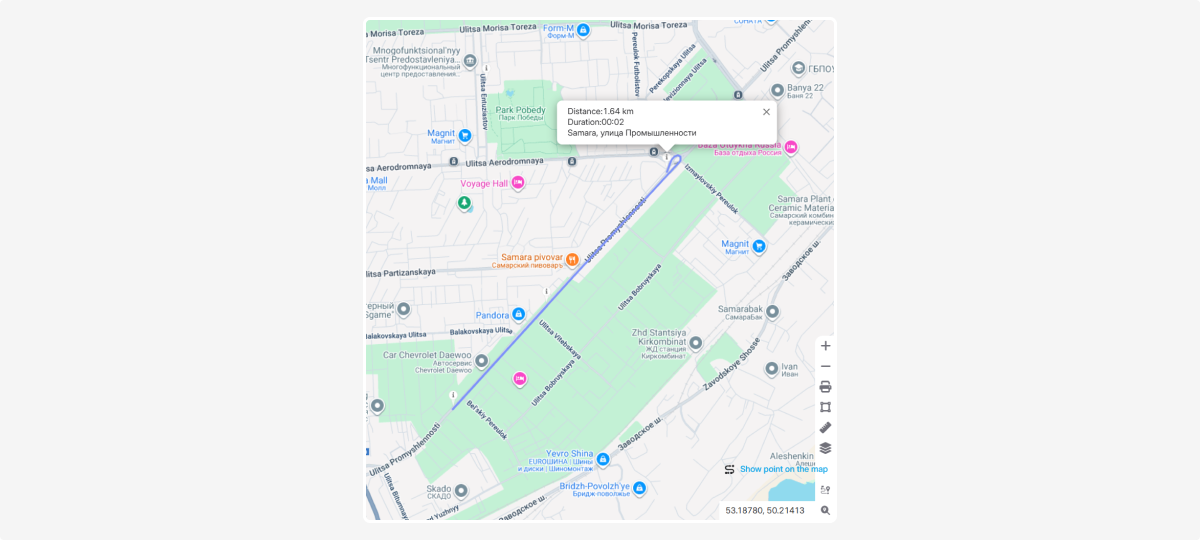
Measuring distance along roads
This tool lets you determine the road distance between selected points on the map.
How to use:
-
Click the first point on the map
2. Mark the intermediate waypoints along the route
3. Finish the route with a final click at the endpoint
4. The system will automatically calculate the path along existing roads. The total distance and estimated travel time will be shown on the screen.
Distance to the nearest vehicle
This tool helps you quickly find the nearest vehicle and see the distance to it from a selected point on the map.
How to use:
-
Click any point on the map for which you want to find the nearest vehicle.
2. The system will automatically determine the nearest vehicle and display:
— the vehicle number or object name
— the distance from the selected point to the vehicle
— the estimated time it will take the vehicle to reach the point
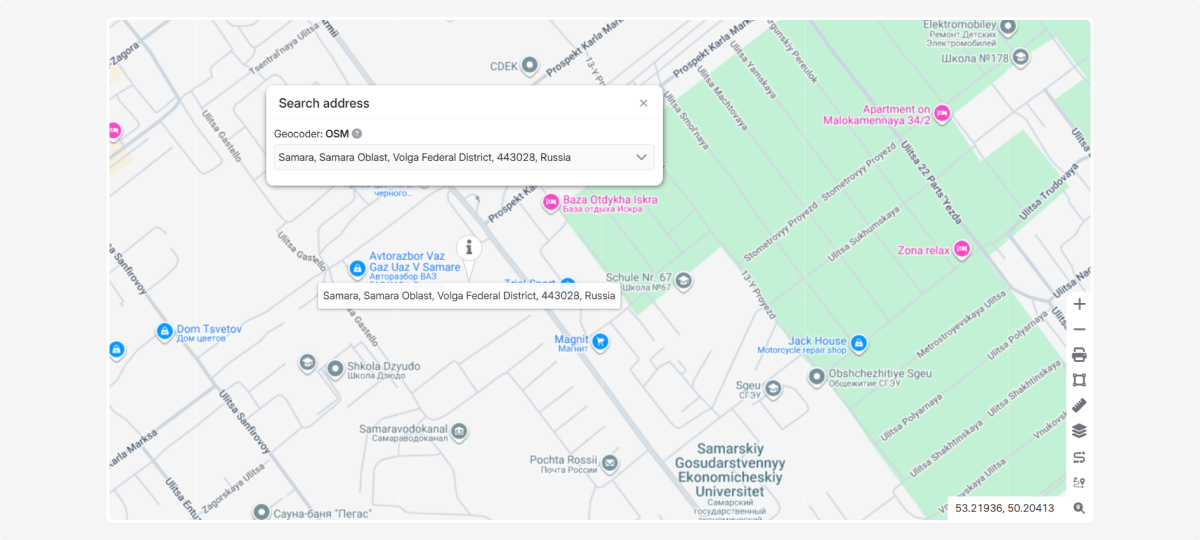
Geocoder
The geocoder lets you find a point on the map by address.
How to use:
1. Enter an address or coordinates in the geocoder field
2. A suggestion with a refined address will appear under the input
3. Click the exact address from the dropdown list
4. View the desired point on the map
Coordinates
Additional map features
In the top-right corner of the map, you’ll find extra tools: object layers, street view, and traffic.

Object layers
The Object layers feature turns on/off additional geographic data from uploaded KML/KMZ files on top of the basemap.
How to use:
-
Find the Object layers panel in the top-right corner of the map
2. Expand the list of available layers and check the ones you want to display
You can enable multiple layers at once, or turn them all off to show only the base map.
For instructions on uploading and working with KML/KMZ files, see the KML Settings section.
Street view
The Street view feature lets you see panoramic, street-level photos of an area.
Available sources:
GSV — Google Street View: high-quality imagery with broad coverage.
YR — Yandex street panoramas: strong coverage in Russia and some neighboring countries.
OSC — Community-sourced panoramas: may provide more recent imagery in some areas.
To enable Street view:
-
Check this option in the top-right of the map
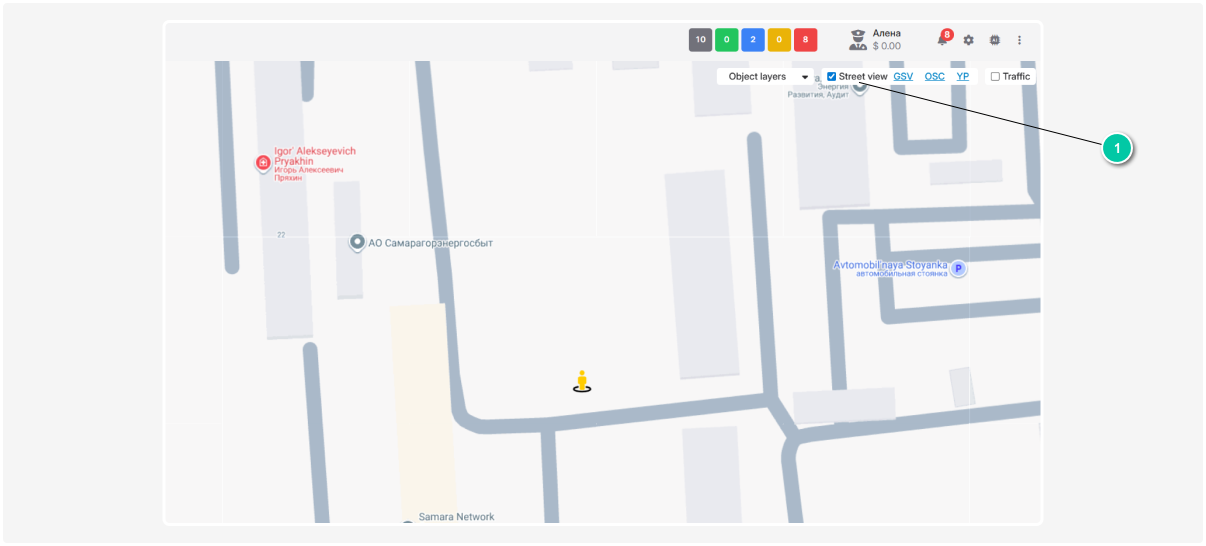
2. Drag the yellow person (Pegman) onto the desired place on the map
3. Choose GSV, YR, or OSC
4. The corresponding panoramic service will open, where you can view interactive panoramas of the selected area.
Traffic
The Traffic layer shows current road congestion using color indicators:
-
Green — free flow
-
Yellow — moderate traffic
-
Red — heavy congestion
To turn on traffic, check this option in the top-right corner of the map.

The system includes weather visualization from Windy.com — an online platform with interactive weather maps and forecasts.
Weather data is displayed as an overlay on the map and automatically synchronizes with map panning and zooming.
How to enable the weather layer
1. Get an API Key
1) Register on the Windy API portal
2) Generate an API key
3) You will receive a key in the following format: 4epwZKT8erOIe6Boq2gfdhffs50ky
By default, a trial key is issued.
Trial limitations:
— Up to 500 sessions per day
— GFS model only
— Available layers: Wind, Temperature, Pressure
2. Configure the Key in PILOT
To make the weather layer available:
1) The Windy configuration must be enabled in the account.
2) In the Admin panel, open the account settings and add the parameter: windy_api_key = your_key
After saving the settings, the weather functionality becomes available to users of the account.
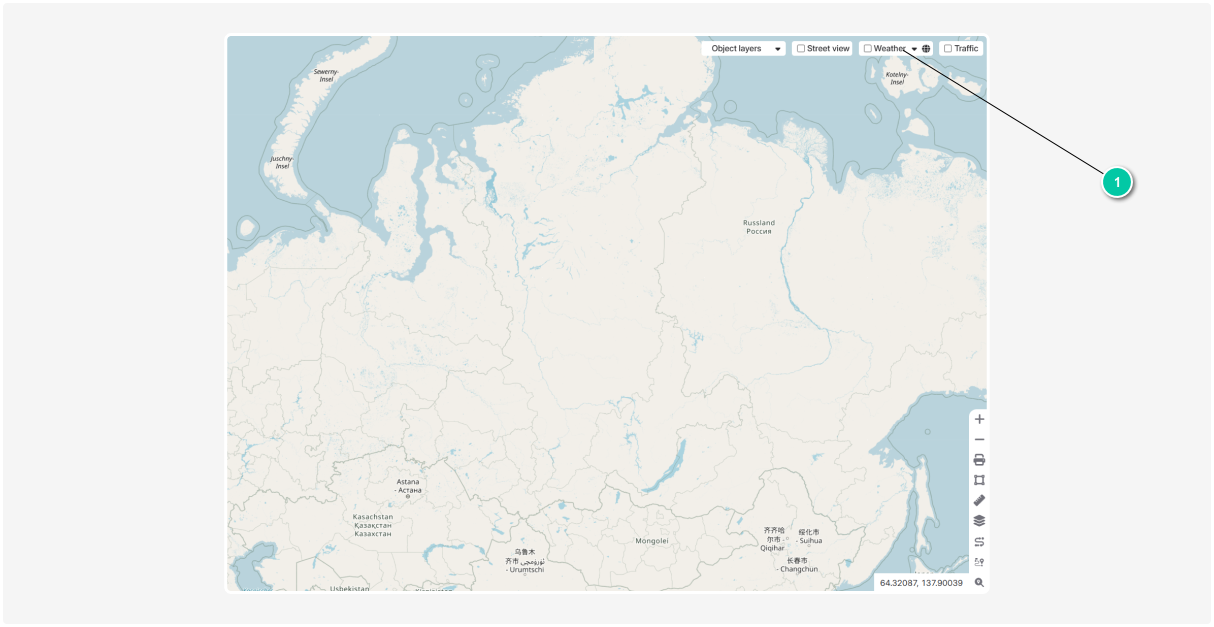
How to enable weather
1. Open the map
2. In the layer list, the Weather checkbox will appear
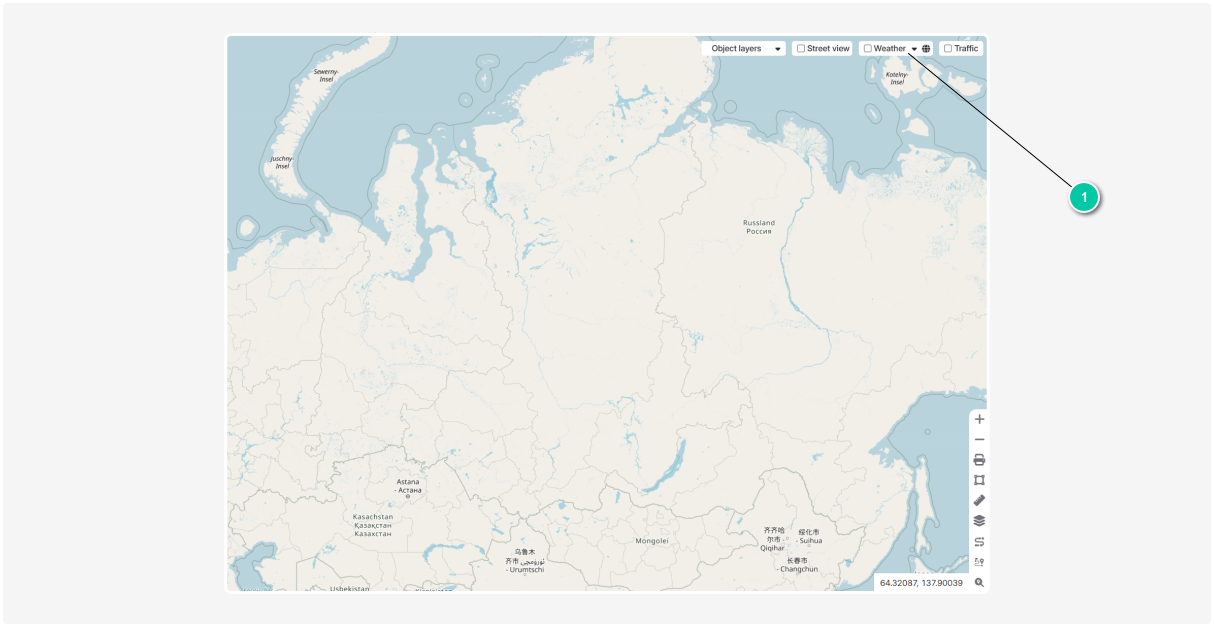
3. Check the box
4. The weather overlay will appear on the map, and the forecast timeline panel will be displayed at the bottom

To disable weather, simply uncheck the box.
How to select a forecast model
Click the globe icon 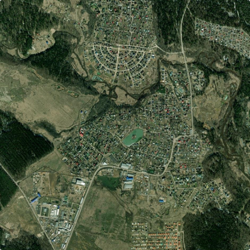 in the weather panel and select a model.

Model availability depends on your subscription tier.
Free
-
GFS — Global model with basic resolution. Suitable for a general overview of worldwide weather conditions.
Pro
-
ICON — High resolution for Europe
-
NAM — Accurate model for North America
-
AROME — Very high resolution (especially for France and nearby regions)
-
GEOS5 — NASA global analysis model
-
CAMS — Air quality monitoring model
-
HRRR — Hourly refresh model for the USA
ECMWF (with separate subscription)
-
ECMWF — One of the most accurate global forecast models, used for professional analysis
The system automatically detects your tier and displays only the models available to you.
How to select a weather overlay type
Click the dropdown arrow and select the data type.
Free:
-
Wind
-
Temperature
-
Pressure

Pro (additional):
-
Humidity
-
Precipitation
-
Thunderstorms
-
Cloud cover
-
Visibility
-
Satellite imagery
-
Weather radar
-
and other professional parameters
After selection, the map updates automatically.
How to use the timeline panel
When the weather layer is enabled, a timeline panel appears at the bottom of the map. It allows you to view the forecast by hours and days.
-
 Play — Starts forecast animation. The map shows weather changes over time
 -
 Pause — Stops the animation at the selected moment
 -
Time slider — Drag manually to jump to a specific date and time
The timeline panel is visible only when the weather layer is enabled.
If weather is disabled, the panel is automatically hidden.
