How to use the Report builder
The Report builder lets you create your own report layout with the columns, filters, and calculation logic you need.
In this article, you’ll learn:
-
How to create a report — step-by-step setup of a report form
-
How to build a report — launch a report from the Builder
-
Report grouping — how to group data
-
Interface overview — what the Builder includes
-
Report configuration — how to additionally configure the report
-
Import and export — how to move reports between accounts
1. Go to the Reports section
2. Find the Builder button 
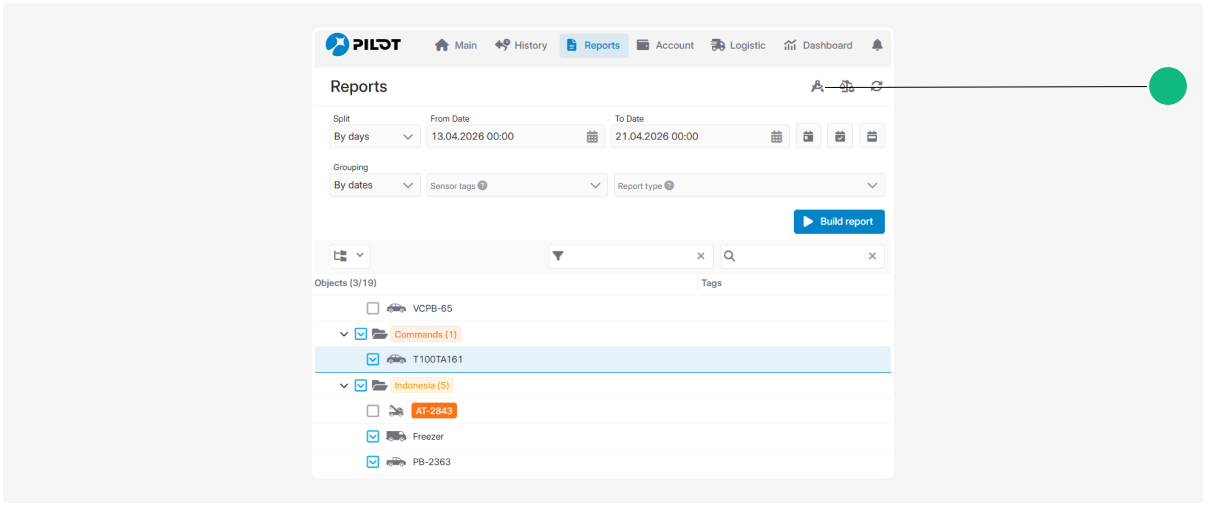
3. Click it — the Report Builder window will open
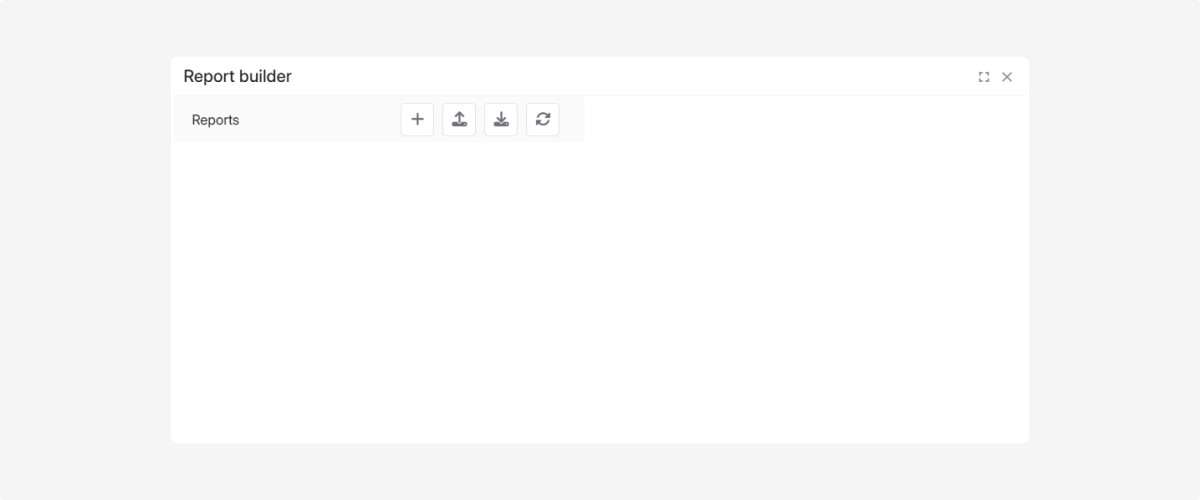
In the builder:
4. Click Add 
5. Select the report type
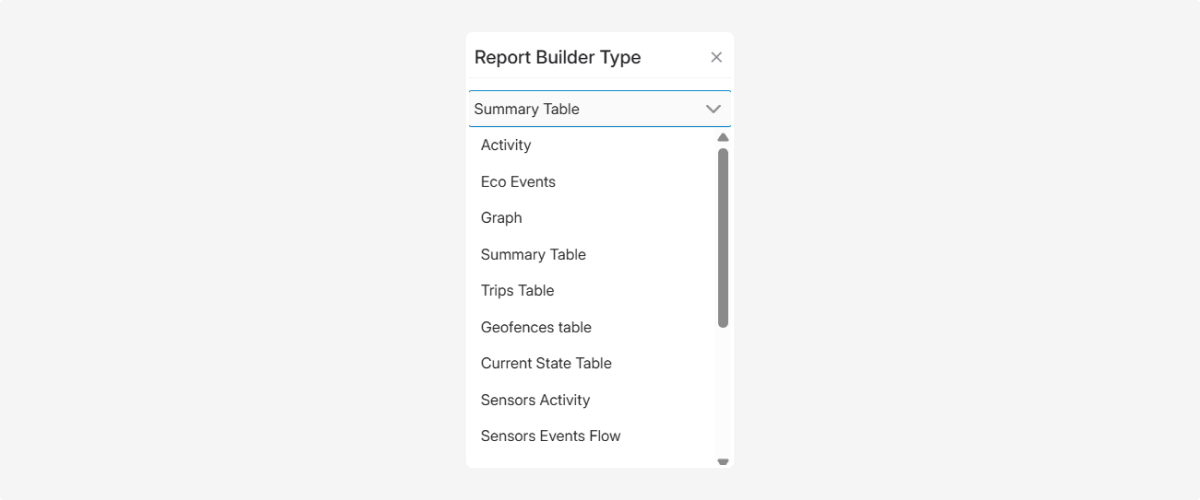
6. In the Name field, enter the report name

7. In the Columns section, click  and add the required fields
and add the required fields8. Set up the column data, formulas, filters, and other parameters
9. If needed, fill in the Configuration field
10. Click Save
After saving, the report will be available in the Reports section.
Example report
For example, you can create an Idle – Summary Table report.

Report type: Summary table
Added columns:
-
Vehicle — the object the report is based on
-
Idle time — the duration of idling
-
Total idle events — the number of events
-
Fuel at beginning — fuel level at the beginning
-
Fuel at end — fuel level at the end
In the Configuration field, you can set a filter so the report includes only the data you need.
For example, to show only objects with idle events:
{"filter":[{"key":"total_idle_events_number","rule":">","value":0}]}
|
Once the report is created and saved in the Builder, it becomes available in the Reports section.
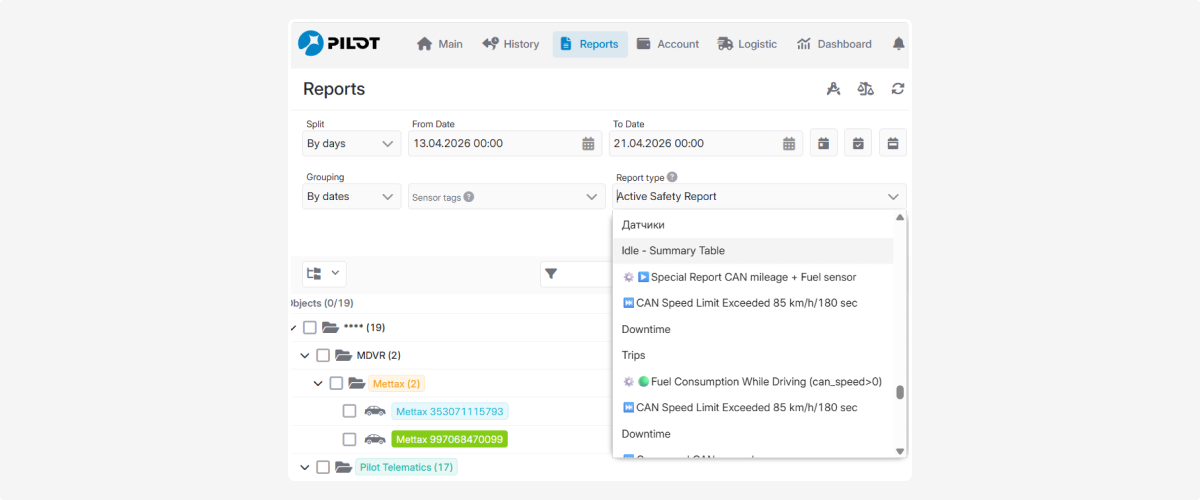
1. Go to the Reports section
2. Select the object by checking it in the list
3. Choose the report you created in the Builder
4. Specify the time period and any additional parameters
5. Click Build report

The system will generate the report using the selected layout.
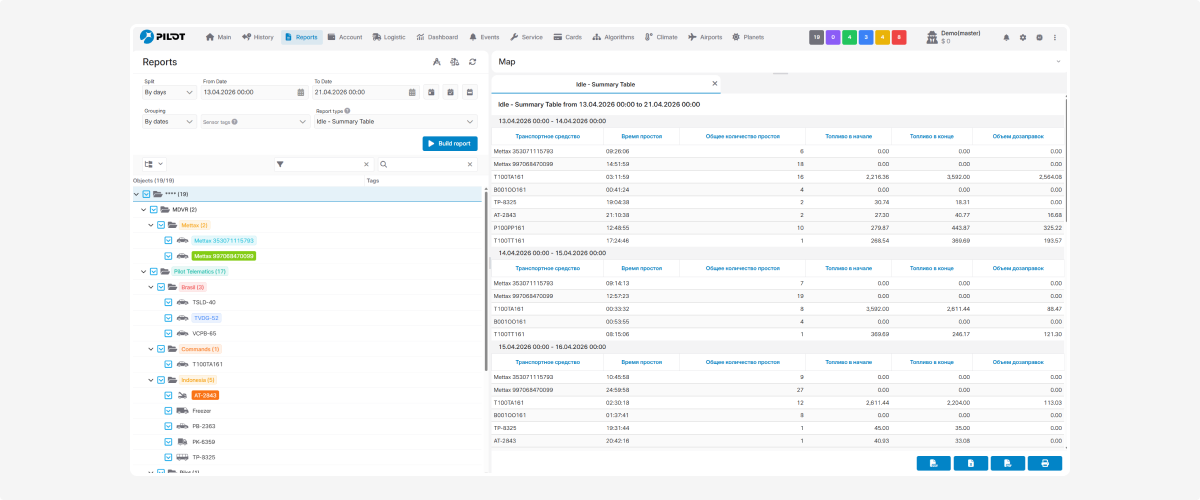
You can then:
-
view and analyze the report
-
export it to CSV, Excel, or PDF —

-
print it —


You can organize the data in a report created with the Report builder into separate sections. Depending on the report type, the following grouping options may be available:
-
by drivers
-
by dates
-
by objects
-
by object groups
To configure grouping:
1. Go to Reports
2. Select a report created with the Report builder
3. Select the required option from the Grouping list

4. Select the objects and, if necessary, other data for the report
5. Click Build report
For example, when data is grouped by object groups, a separate section containing the corresponding data is created for each selected group.


On the left, there is the Reports panel with the list of reports already created.
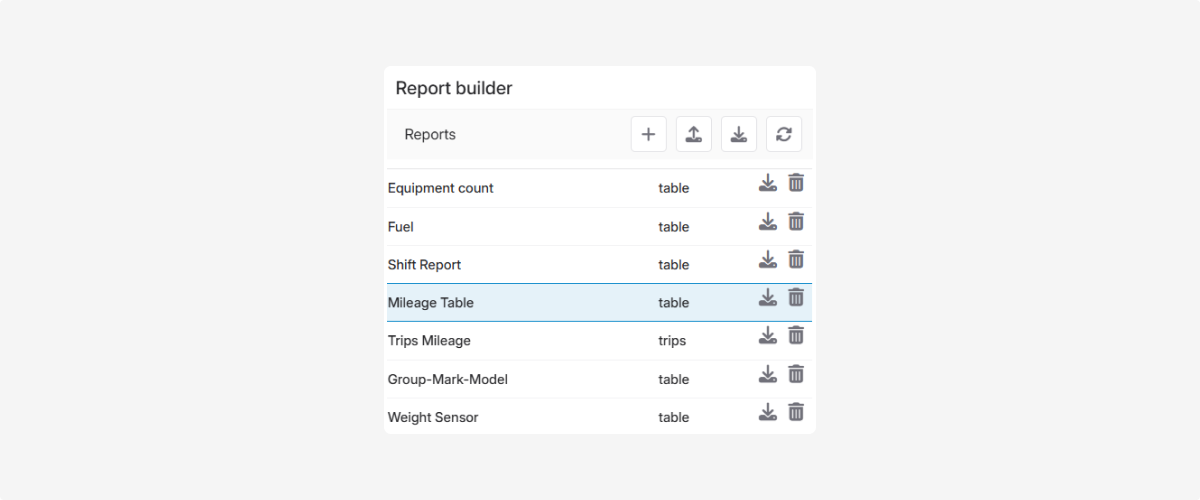
It includes the list of saved reports and management buttons:
 — create a new report
 — import or export a report
 — refresh the list
On the right, there is the settings area for the selected report:

-
Type — the report builder type
-
Name — the report name
-
Sorting — the order in which data is displayed
-
Desc — descending sort order
-
Columns — report structure settings
-
Configuration — additional report settings in JSON format. This lets you control how data is displayed in the report.
The Configuration field is used for additional report settings. Parameters are specified in JSON format and determine how the report data is processed and displayed.

Splitting data by hour
To divide the report data into hourly intervals, enter:
{"split": "hour"}
|
When the report is generated, the data for each hour is displayed in a separate section.

Report data can be divided into work shifts. The system creates a separate interval for each shift and calculates metrics using only the data associated with that interval.
To configure the split, specify the start and end times of each shift in the split parameter, for example:
{
"split": ["08-20", "20-08"]
}
|
This example defines two shifts:
-
from 08:00 to 20:00
-
from 20:00 to 08:00 on the following day
If the show parameter is not specified, the report displays all configured shifts.
Example of a report for all shifts
In this example, the Forklift Operation Timeline report is divided into day and night shifts. Each shift is displayed in a separate section containing the object, the interval start and end times, and the equipment operation metrics.
The night shift is displayed as one continuous interval from 20:00 on the current day to 08:00 on the following day.
Because the selected report period starts at 00:00, the beginning of the report also displays the remaining part of the night shift, from 00:00 to 08:00.

Displaying a single shift
To include only one of the configured shifts in the report, add the show parameter:
{
"split": ["08-20", "20-08"],
"show": 1
}
|
The parameter value corresponds to the shift’s position in the list:
-
show: 1— display the first shift, from 08:00 to 20:00
-
show: 2— display the second shift, from 20:00 to 08:00
Example of a report for a single shift
In this example, the show: 1 parameter is specified, so the report contains only day shifts from 08:00 to 20:00. A separate section is created for each day. Night shifts are not displayed in the report.

Splitting a shift at midnight
By default, a shift from 20:00 to 08:00 is treated as one continuous interval. To split it at the calendar-day boundary, add the split_days parameter:
{
"split": ["08-20", "20-08"],
"split_days": 1
}
|
The night shift is divided into two intervals:
-
from 20:00 to 00:00
-
from 00:00 to 08:00
The day shift remains a single section from 08:00 to 20:00.
The show parameter is not specified because the report includes both day and night shifts.

All parameters can be used together:
{
"split": ["08-20", "20-08"],
"show": 1,
"split_days": 1
}
|
In this example, the report displays only the first shift, while shifts that cross midnight are divided by calendar day.
You can use the configuration to specify which data should be included in the report.
For example, the following columns can be added to the Idle – Summary Table report:
-
Vehicle
-
Idle time
-
Total number of idle events
-
Fuel at start
-
Fuel at end
To include only objects with at least one recorded idle event, enter:
{"filter":[{"key":"total_idle_events_number","rule":">","value":0}]}
|
As a result, rows in which Total number of idle events equals zero are not displayed.
To merge multiple rows from the same split period into a single summary row, enter:
{"merge": true}
|

The merged row displays the values of the configured columns, while the intermediate rows are hidden. Configure the columns to include in the report and save the changes.
Row merging example

In this example, the report is grouped by drivers and split by day. A separate section is created for each driver, and the driver’s data for each day is merged into a single row.
The row displays the vehicle, date, first trip start time, last trip end time, total driving time, total idle time, and total mileage for the day.
Reports created in the Builder can be transferred between accounts. Use the Export and Import buttons for this.
and Import buttons for this.
How to export a report
1. Click Export
2. Choose a location on your device
3. Save the file
How to import a report
1. Click Import
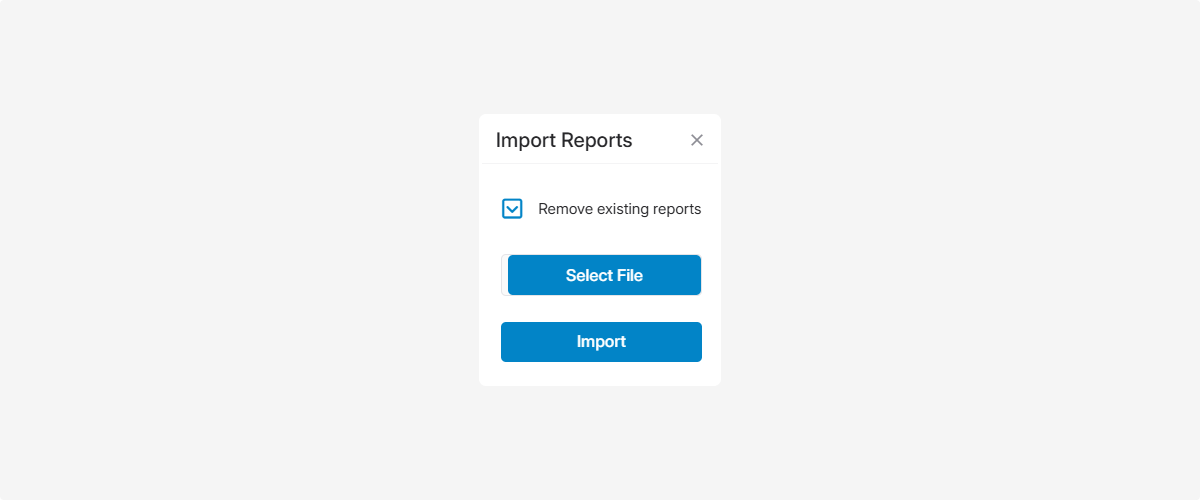
2. In the window that opens, if needed, enable Remove existing reports if you want to delete existing reports in the Builder.
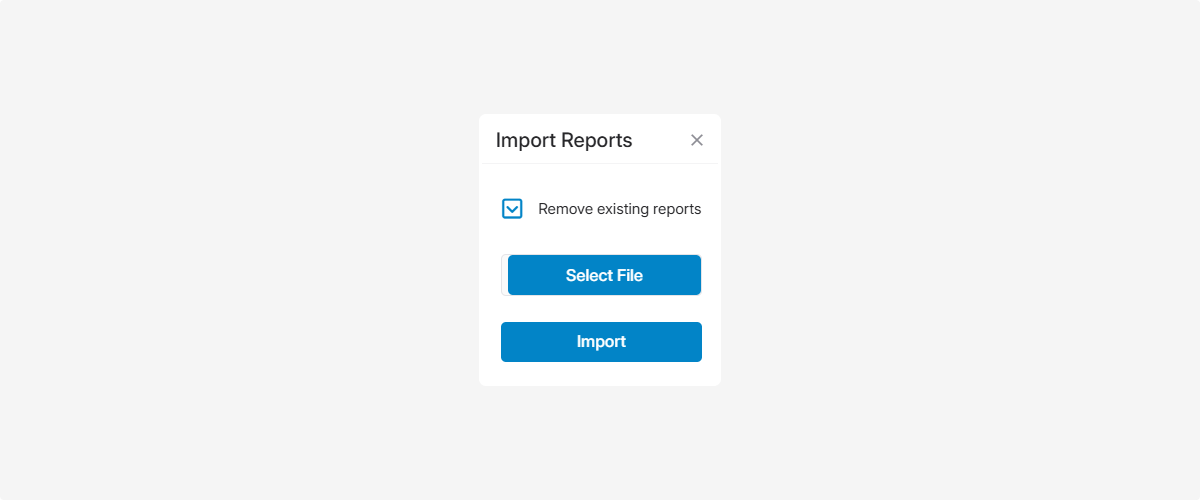
3. Select the report file
4. Click Import
The report will be uploaded to the account.